Standard data miners produce classifiers that can categorize a new example into some class.
A treatment learner finds rules that change the expected class distribution (compare to some baseline).
Classifiers are used for recognition tasks; e.g. find what toys to remove from the assembly line because they are defective.
Treatment learners are used for planning some minimal action to improve the odds that something will be later be recognized as belonging to some class. A treatment learner could be used to make repairs to the defective toys rejected from the assembly line.
Treatment learners are all about minimality that is, what is the least you need to do to most effect something.
Classifiers are all about representational accuracy. If the target complex is complex then the resulting tree can be complex.
For example, here's WEKA's J4.8. learning from 506 examples of low, medlow, medhigh, high quality house from Boston:
 LSTAT <= 14.98
 |   RM <= 6.54
 |   |   DIS <= 1.6102
 |   |   |   DIS <= 1.358: high (4.0/1.0)
 |   |   |   DIS > 1.358
 |   |   |   |   LSTAT <= 12.67: low (2.0)
 |   |   |   |   LSTAT > 12.67: medlow (2.0)
 |   |   DIS > 1.6102
 |   |   |   TAX <= 222
 |   |   |   |   CRIM <= 0.06888: medhigh (3.0)
 |   |   |   |   CRIM > 0.06888: medlow (4.0)
 |   |   |   TAX > 222: medlow (199.0/9.0)
 |   RM > 6.54
 |   |   RM <= 7.42
 |   |   |   DIS <= 1.8773: high (4.0/1.0)
 |   |   |   DIS > 1.8773
 |   |   |   |   PTRATIO <= 19.2
 |   |   |   |   |   RM <= 7.007
 |   |   |   |   |   |   LSTAT <= 5.39
 |   |   |   |   |   |   |   INDUS <= 6.41: medhigh (25.0/1.0)
 |   |   |   |   |   |   |   INDUS > 6.41: medlow (2.0)
 |   |   |   |   |   |   LSTAT > 5.39
 |   |   |   |   |   |   |   DIS <= 3.9454
 |   |   |   |   |   |   |   |   RM <= 6.861
 |   |   |   |   |   |   |   |   |   INDUS <= 7.87: medhigh (9.0)
 |   |   |   |   |   |   |   |   |   INDUS > 7.87: medlow (3.0/1.0)
 |   |   |   |   |   |   |   |   RM > 6.861: medlow (3.0)
 |   |   |   |   |   |   |   DIS > 3.9454: medlow (14.0/1.0)
 |   |   |   |   |   RM > 7.007: medhigh (29.0)
 |   |   |   |   PTRATIO > 19.2: medlow (11.0/1.0)
 |   |   RM > 7.42
 |   |   |   PTRATIO <= 17.9: high (25.0/1.0)
 |   |   |   PTRATIO > 17.9
 |   |   |   |   AGE <= 43.7: high (2.0)
 |   |   |   |   AGE > 43.7: medhigh (3.0/1.0)
 LSTAT > 14.98
 |   CRIM <= 0.63796
 |   |   INDUS <= 25.65
 |   |   |   DIS <= 1.7984: low (5.0/1.0)
 |   |   |   DIS > 1.7984: medlow (37.0/2.0)
 |   |   INDUS > 25.65: low (4.0)
 |   CRIM > 0.63796
 |   |   RAD <= 4: low (13.0)
 |   |   RAD > 4
 |   |   |   NOX <= 0.655
 |   |   |   |   AGE <= 97.5
 |   |   |   |   |   DIS <= 2.2222: low (8.0)
 |   |   |   |   |   DIS > 2.2222: medlow (6.0/1.0)
 |   |   |   |   AGE > 97.5: medlow (5.0)
 |   |   |   NOX > 0.655
 |   |   |   |   CHAS = 0: low (80.0/8.0)
 |   |   |   |   CHAS = 1
 |   |   |   |   |   DIS <= 1.7455: low (2.0)
 |   |   |   |   |   DIS > 1.7455: medlow (2.0)
Treatment learners generate more succinct output. First, it tells us the baseline distribution of the classes:
             low:~~~~~~~~~~~~~~~~~~~~~~~~~~~~~~  [   133 - 29%]
          medlow:~~~~~~~~~~~~~~~~~~~~~~~~~~~~~   [   131 - 29%]
         medhigh:~~~~~~~~~~~~~~~~~~~~~           [    97 - 21%]
            high:~~~~~~~~~~~~~~~~~~~~~           [    94 - 21%]
Next, it tells us the best treatment; i.e. some constraint which when applied to the dataset selects examples with a better distribution:
 Treatment:[PTRATIO=[12.6..16)
            RM=[6.7..9.78)]
It then shows a prediction of what happens when this constraint is applied to the data:
            low:                                [     0 -  0%]
         medlow:                                [     0 -  0%]
        medhigh:                                [     1 -  3%]
           high:~~~~~~~~~~~~~~~~~~~~~~~~~~~~~~  [    38 - 97%]
In this case, the learner is saying that if we focus only one houses with 7 to 9 rooms in suburbs where the parent teacher ration between 12.6 to 16, then we we only find good houses.
Note that:
Treatment learners assess their theories by comparing a weighted sum of the classes in the baseline to the a weighted sum of the classes in the prediction. The sum is normalized so the baseline distribution is said to have a lift of ``1''. FYI, the above predicted distribution has a lift of ``2.34''.
Note that different treatment learners call ``lift'' by a variety of names; e.g. worth, etc. Whatever- its all really lift.
Ideally, treatments have large lift and this can be achieved by making the treatment more specific; i.e. adding in more conjunctions.
However, the larger the conjunction, the less likely that any particular example in the current data set will satisfy the treatment. That is, the higher the lift, the less evidence will be available that that treatment actually achieves that lift. This threatens the external validity of the learnt treatment.
In order to remove this over-fitting bias, treatment learners use best support; i.e. the percentage of the best classes seen in the proposed treatment. Treatments are rejected that do not satisfy the minimal best support.
Minimal best support is also known as BestClass. Increasing BestClass increases the external validity but tend also to reduce the lift (since the larger the treatment, the less likely a member of the best class will fall into the treatment).
A consequence of using BestClass/minimal best support is that treatments are very small (typically, conjunctions of size four or less). Small treatments are useful when (e.g.) explaining a theory to a human or (e.g.) designing some device that will use the learnt theory. In both cases, the fewer the attributes in the learnt theory, the less we need to (e.g.) understand or (e.g.) add sensors to a house-hunting robot or (e.g.) write queries into some database.
Classes have weights
Baseline best = number of highest weighted instances
Yield = sum of class frequency*weight
Baseline = yield of all data
Treatment = RX = {Attribute=value}+
Selected = subset of data consistent with RX
Lift = yield (selected) / baseline
Rx learning= seek smallest treatment
Randomly select N- the size of the treatment. Pick this at random from 1 to some user specified parameter MaxSize.
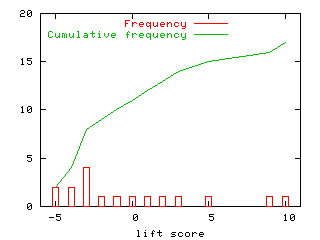
Randomly select N promising ranges as follows. First calculate the lift of each individual attribute value then search through combinations of the highly scoring values. Usually, there are some outstandingly high scoring values. For example, the red bars below show the lift scores for 16 different attribute values score in the iris domain (don't worry about the negative numbers, there just artifacts of quirks of the lift calculation).
Note that of the 16 values, two score outstandingly high (9 and 10). That is, in this domain, treatments can be very small since there exist a very small number of very powerful ``lifting'' values.
Try combining the promising treatments as follows:
The TAR3 treatment learner needs 3 files to run. For the housing example, those files are:
Note that the order of the classes on line one is very important. Classes are weighted left-to-right, lest-to-most. TAR3 will seek treatments that select for the right-hand-side higher weighted classes while avoiding the left-hand-side lower weighted classes.
The names and data files are in C4.5 format and can contain comments (after ``|'' characters).
A sample names file for the housing example is included here. Note the order of the classes: this names file would be used to find good houses:
low,medlow,medhigh,high | "worst"=low; "best"=high
 CRIM:   continuous  | crime rate
 ZN:     continuous  | % land zoned for lots over 25,000 sq.ft.
 INDUS:  continuous  | % non-retail business acres per town
 CHAS:   continuous  | "1" is near Charles River
 NOX:    continuous  | nitric oxides concentration
 RM:     continuous  | number of rooms per dwelling
 AGE:    continuous  | %owner-occupied units built prior to 1940
 DIS:    continuous  | distances to five Boston employment centers
 RAD:    continuous  |index of accessibility to radial highways
 TAX:    continuous  | full-value property-tax rate per $10,000
 PTRATIO:continuous  | pupil-teacher ratio by town
 B:      continuous  |
 LSTAT:  continuous  | % lower status of the population
The configuration file control TAR3's search. A useful set of defaults for the above are:
 granularity:    5
 maxNumber:     10
 maxSize:        4
 randomTrials:  50
 futileTrials:   5
 bestClass:     33%
The first two options rarely change and control how much many times TAR3 builds treatments.
randomTrials: 50
This is the maximum number of RandomTrials to compose a treatment tried before we pause to look for new best treatments.
futileTrials: 5
This is the number of pauses (so the total number of runs is 50*5).
maxSize: 4
When composing a treatment, TAR3 will build constraints of up to MaxSize items. The upper bound on this number is the number of treatments but, in practice, a MaxSize of 5 suffices.
granularity: 5
Granularity is the number of percentile chops. Granularities over 7 are rarely useful and for problematic data sets, this number can go as low as 2. For reporting purposes, an odd number for Granularity is best since (e.g.) a Granularity of 5 can be reported as ``3 means no change, 4 and 2 means some changes up and down, and 5 and 1 mean larger changes up and down''.
maxNumber: 10
TAR3 only reports the top MaxNumber of treatments.
bestClass: 20%
BestClass is what TAR3 calls the minimum best support threshold. TAR3 rejects any treatment that contains less than BestClass percentage of the best class.
These configuration settings should be tweaked if the external validity of the learnt treatments is weak. This process is explained below.
In order to check external validity of the learnt treatment, it is best to run xval, TAR3's cross-validation facility. By checking the output of xval, we can check if the preferred treatment actually appears in ``N'' sub-samples of the available data.
Before running xval, make sure TAR3 works at least once. We'll need a config file:
And here's our check of TAR3:
tar3unix/bin/tar3.sol inspectd
If that works, turn lose the cross-validation (this will take 10 times longer than the above call).
tar3unix/bin/xval.sol tar3unix/bin/tar3.sol inspectd 10
This generates an XDFsum.out file which we can summarize using http://www.cs.pdx.edu/~timm/dm/stable.html
 maxSize:        4
 randomTrials:   50
 futileTrials:   5
 granularity:    7
 maxNumber:      50
 bestClass:      20%
 sirius:~/public_html/dm [602]$ stable -g 0.01 XDFsum.out
 Freq   Lift Treatment
 ====   ==== =========
  10    2.25  _hidesignv3_16=[0.65]
  10    2.25  _hidesign_12=[f]
   9    2.23  _hidesignv2_15=[0.5]
   9    2.23  _hidesignv1_14=[0.35]
   5    2.30  _hidesignv3_16=[0.65] _loDist_23=[tr]
   5    2.26  _hiStaff_17=[4] _hidesignv1_14=[0.35]
   5    2.11  _hiStaff_17=[4]
   4    2.34  _codev3_36=[0.65] _hidesignv3_16=[0.65]
   4    2.29  _hidesign_12=[f] _lodesign_22=[f]
   4    2.27  _hiStaff_17=[4] _hidesignv2_15=[0.5]
   4    2.27  _codev3_36=[0.65] _hidesign_12=[f]
Good news: best treatments found at less than maxSize so there's no need to increase that.
Better news, there's bunch of treatments that are stable across the 10-way (found in 9/10 sub-samples).
Even better news, the treatments seen quite powerful. Here's the original distribution in this domain:
          class1:~~~~~~~~~~~~~~~~~~~~~~~~~~~~~~  [   467 - 40%]
          class2:~~~~~~~~~~~~~~~                 [   234 - 20%]
          class3:~~~~~~~~~~~~~~~                 [   234 - 20%]
          class4:~~~~~~~~~~~~~~~                 [   234 - 20%]
Here's what a lift of 2.25 looks like:
          class1:                                [     0%]
          class2:                                [     0%]
          class3:~~~~~~~                         [    20%]
          class4:~~~~~~~~~~~~~~~~~~~~~~~~~~~~~~  [    80%]