|
|
Lectures (2)
No theory this week- just a big Prolog tut.
Your first assignment is to deliver an environment
like the one shown in a
sample rule-based DSL
called
RULER. This environment
has 4 windows:
- Top right: the main window. Shows a list of reports.
- Bottom right: shows report details- lists of things to look at.
- Top left: the biggest window- shows big stuff. Usually, selecting a something from a report list updates this screen.
- Bottom left: the extra credit window. TBD.
For your DSL, you have to identify the main language features
and how they connect. In RULER, these are types such as
p = person(age,name,sex,status).
|
and preferences such as
app             == 'Wide world of timm'.
owner           == 'Tim Menzies'.
elm             == 'tim@menzies.com'.
maxErrors       == 3.
warnOnTypeClash == no.
|
and procedures such as
say(X) means
    print(X),
    nl.

below(A,B) means
    val(A,X),
    X <  B.

equals(A,B) means
    val(A,B).
|
and rules such as:
r2
if   sex equals male
      and age below 16
then  status := inJail.

r3
if    status equals inJail
then  say haha.
|
The environment RULER shows
all these, plus the links between them all.
To find these links, two tricks are used:
- Term_expansion side effects. As a side-effect of
loading some term X, we write a little memo saying where X came from.
The memo is the at/4 fact:
term_expansion((X means Y), [(X :- Y),
                         at(File,Line,proc,F/A)]) :-
    functor(X,F,A),
    here(File,Line).

here(File,Line) :-
    source_location(Path,Line), % swi built-ins
    file_base_name(Path,File).  % swi built-ins
|
- Naming each line.
A small prolog utility slurps Prolog source code,
and adds a URL name to each line showing it's line number.
For example, the file
:- op(1200, xfx, means).
:- op(999, xfx, if).
:- op(998, xfx, then).
:- op(997, xfy, or).
:- op(996, xfy, and).
:- op(995,  fy, not).
:- op(700,  fx, say).
:- op(700, xfx, [upto,below,equals,over,downto,in, := ]).
:- op(1,   xfx, to ).
|
gets slurped into
<html><body bgcolor=white><h4>%ops.pl</h4><pre>
<a name="1">:- op(1200, xfx, means).
<a name="2">:- op(999, xfx, if).
<a name="3">:- op(998, xfx, then).
<a name="4">:- op(997, xfy, or).
<a name="5">:- op(996, xfy, and).
<a name="6">:- op(995,  fy, not).
<a name="7">:- op(700,  fx, say).
<a name="8">:- op(700, xfx, [upto,below,equals,over,downto,in, := ]).
<a name="9">:- op(1,   xfx, to ).
</pre>
|
Combining these two techniques means that we can point to
any part of the code using the at/4 fact.
Oh, and here's the slurp utility:
% something simple first: echo a line
echoLine :-
    repeat, get_char(X), writeChar(X), endEchoLine(X),!.

endEchoLine('\n').
endEchoLine(end_of_file).

writeChar(end_of_file) :- !.
writeChar('<') :- write('<'),!.
writeChar('\n') :- !.
writeChar(X) :- write(X).

% main driver- note that file I/O is seperated
% from the predicate doing the work
file2html(X) :-
    pl2html(X,H),
    format('\t~w ==> ~w\n',[X,H]),
    see(X),
    tell(H),
    ignore(file2html1(X)), % even if this fails,
                           % close all file streams
    seen,
    told.

% here's the predicate actually doing all the work
file2html1(X) :-
    file2htmlHeader(X),
    file2htmlBody(1),
    file2htmlTail.

file2htmlHeader(X) :-
    format('<html><body bgcolor=white><h4>\%~w</h4><pre>\n',[X]).
file2htmlBody(_) :- at_end_of_stream,!.
file2htmlBody(N0) :-
    format('<a name=\"~w\">',[N0]),
    echoLine,
    nl,
    N is N0 + 1,
    %write(user,N0),nl,
    file2htmlBody(N).
file2htmlTail :-
    write('</pre>'),nl,
    forall(between(1,50,_),write(' <p>\n')),
    write('</body></html>').
|
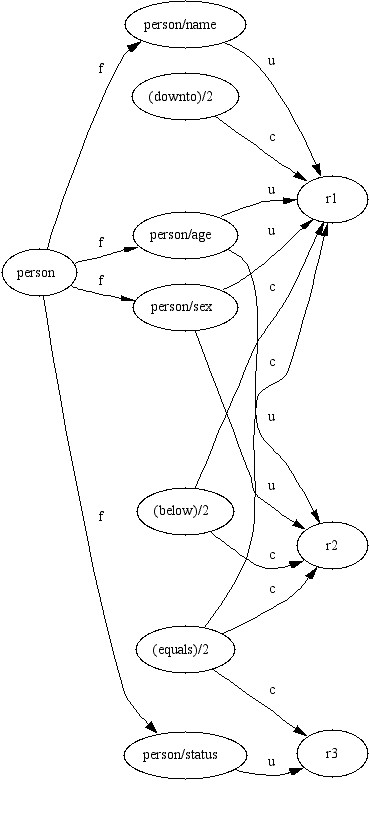
Once all those at/4 facts are asserted, we can
also draw a dependancy diagram between items in our DSL.
The graphviz utility (which is free to
download) can auto-layout graphs via its dot program. dot
source looks like this:
digraph states {
    size="3,2";
        rankdir=LR;
    node [shape=ellipse];
    empty [label = "Empty"];
    stolen [label = "Stolen"];
    waiting [label = "Waiting"];
    full [label = "Full"];
    empty -> full [label = "return"]
    empty -> stolen [label = "dispatch", wt=28]
    stolen -> full [label = "return"];
    stolen -> waiting [label = "touch"];
    waiting -> full [label = "return"];
  }
|
from which dot can make a gif file using the command line
dot -Tgif ..\graphs\directed\states.dot -o c:\temp\stats.gif
|
which looks like this:
 We can write Prolog code to:
- Query the at/4 facts to generate edges and nodes
- For each node, write one node definition statement in dot notation.
- For each edge, write one edge definition statement in dot notation.
- Dump the result to a .dot file.
- Call dot to generate the gifs as follows:
dotty(Dot,Gif,Pos) :-
    sformat(Todo1,
 'cmd /c "c:\\program files\\graphviz\\bin\\dot.exe" -Tgif ~w -o ~w',
            [Dot,Gif]),
    sformat(Todo2,
 'cmd /c "c:\\program files\\graphviz\\bin\\dot.exe"  ~w -o ~w',
            [Dot,Pos]),
    win_exec(Todo1,iconic),
    win_exec(Todo2,iconic).
|
Voila:
 Dot can also generate a file that describes the
position
of each node in the graph.
Now a really smart person could use to build an html clickable map so that in the bottom right window of RULER, someone
could see node details if they click on a node in the gif shown top left.
Not © Tim Menzies, 2001
Share and enjoy- information wants to be free.
But if you take anything from this site,
please credit tim@menzies.com.
|
|


